Average Car Loan Rate in 2026: Your Benchmarking Guide

As of Q1 2026, Experian reports the national average APR at 6.39% for new cars and 11.43% for used cars. Those numbers are your starting line. If a dealer quotes you 9% on a new car and your credit is solid, you’re looking at money left on the table. The gap between the average and a bad offer can easily run $2,000 or more over the life of a loan.
Table of Contents
- What are the current average car loan rates right now?
- How does your credit score affect the APR you’ll be offered?
- How does loan term length change what you actually pay?
- Why do auto loan rates vary by state?
- How to benchmark a dealer APR and negotiate a better rate
- APR versus interest rate: what’s actually included?
- How the averages in this article were selected
- How Baywall turns public averages into your personal benchmark
- Key Takeaways
- The number most buyers never ask for
- Know your number before you sign
- Useful sources for live auto loan rate data
What are the current average car loan rates right now?
The headline figures above come from Experian’s quarterly State of the Automotive Finance Market report, which draws on millions of actual loan originations. But Experian isn’t the only source worth watching.
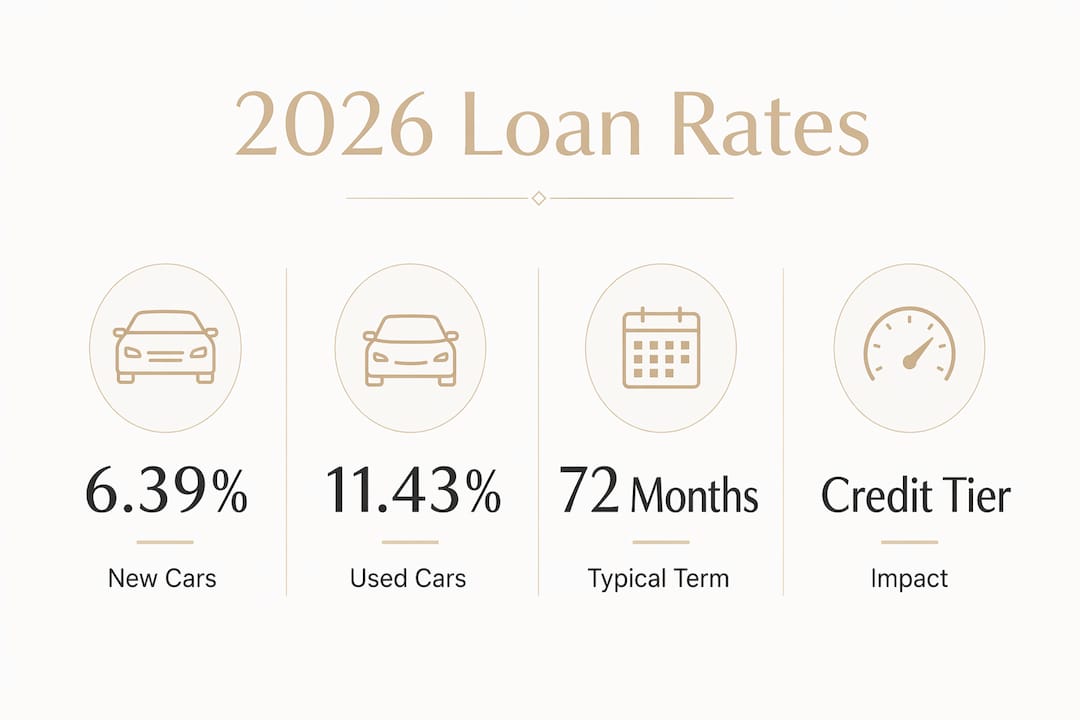
| Loan Type | Average APR | Typical Market Range | Source & Frequency |
|---|---|---|---|
| New car | 6.39% | typical range based on market conditions | Experian, quarterly |
| Used car | 11.43% | typical range based on market conditions | Experian, quarterly |
| New car (60-month) | 6.08% (March 2026) | typical range based on market conditions | FRED/Federal Reserve, monthly |
Edmunds publishes monthly snapshots and state-level breakdowns, which often differ slightly from Experian’s quarterly figures. The Federal Reserve’s ALFRED series (RIELPCFANNM) reported a 60-month new-car finance rate of 6.08% for March 2026, reflecting finance-company originations weighted by loan amount.
Why do sources diverge? Experian pulls from its credit bureau database across all lenders. Edmunds aggregates dealer-originated transactions. The Bankrate Monitor series on FRED tracks weekly survey data from lenders. Each captures a different slice of the market, so a 0.5–1 percentage point spread between sources is normal, not a data error. Cross-referencing at least two sources gives you a more reliable benchmark than relying on any single number.
How does your credit score affect the APR you’ll be offered?
Your credit score is the single biggest lever on your rate. Experian’s Q1 2026 breakdown by VantageScore tier shows just how wide the spread runs:
New-car APR ranges by credit tier (Q1 2026):
- Super-prime (781–850): ~4.55% average APR
- Prime (661–780): approximately 6%–7% range
- Near-prime (601–660): approximately 9%–11% range
- Subprime (501–600): approximately 12%–15% range
- Deep subprime (300–500): ~16.01% average APR
Used-car rates run materially higher at every tier. A near-prime borrower financing a used car can easily see rates above 14%, while a deep-subprime borrower may face 20% or more.
The practical takeaway: improving your credit tier significantly reduces your APR, potentially by several percentage points. On a $30,000 loan over 60 months, that difference translates to roughly $4,000 in total interest. Knowing your tier before you walk into a dealership means you know what to expect and what to push back on.

Pro Tip: Get preapproval from a credit union or bank before visiting any dealer. NerdWallet’s guidance is clear on this: a written preapproval gives you a concrete APR to compare against the dealer’s offer and reduces the chance of accepting a markup you didn’t need to pay.
How does loan term length change what you actually pay?
Longer terms lower your monthly payment but raise your total interest cost, often significantly. Lenders also tend to price 72-month and 84-month loans at slightly higher APRs than 36-month or 48-month loans, compounding the effect.
The table below uses a $30,000 loan to show how term and APR interact. The average new-car loan amount in Q1 2026 was approximately $43,925 with a monthly payment around $770, so these examples are conservative but illustrative.
$30,000 loan: monthly payment and total interest in term and APR
| Term | At 6.39% APR | At 9% APR | At 12% APR |
|---|---|---|---|
| 72 months | 500/mo · — | — | — |
Note: figures are rounded approximations for illustration. Use an auto-loan calculator with your exact rate and fees for precision.
When you’re testing a dealer offer, plug the quoted APR, loan amount, and term into any free auto-loan calculator. Then run the same loan at the national average APR for your credit tier. The difference in total interest is the dollar cost of accepting a higher rate.
Why do auto loan rates vary by state?
National averages are useful baselines, but your state can shift the picture. A few factors drive geographic variation: the density of lenders and credit unions competing for business, state-level regulations on dealer markups, local registration and tax fees that affect the financed amount, and the mix of new versus used vehicles sold in a region.

Edmunds publishes state-level APR breakdowns monthly, making it one of the best places to check whether your state runs above or below the national average. States with fewer competing lenders or higher concentrations of subprime borrowers tend to show higher averages.
When a dealer’s quote runs materially above your state’s average for your credit tier, that gap usually signals one of three things: a dealer markup on top of the buy rate, a vehicle condition or age factor pushing the rate up, or a credit-profile issue the dealer is pricing in. Any of any of those is worth investigating before you sign.
How to benchmark a dealer APR and negotiate a better rate
A written preapproval is your most powerful tool at the table. Here’s the sequence that works:
- Check your credit score before any lender pulls it. Know your tier so you know what range to expect.
- Get preapproved by at least one credit union and one bank. Aim for written offers with a specific APR and loan amount.
- Request the dealer’s written offer with the APR, loan amount, term, and total financed amount clearly stated. Never negotiate on monthly payment alone.
- Compare APR to APR. Your preapproval rate is your floor. If the dealer beats it, great. If not, say: “My bank approved me at X%. Can you match or beat that?”
- Ask for the buy rate. Dealers often mark up the lender’s base rate (the buy rate) and keep the spread. You can ask directly: “What’s the buy rate on this loan?”
- Decline add-on roll-ups until you’ve locked the APR. Extended warranties, GAP insurance, and paint protection rolled into the loan inflate the financed amount and can obscure the true rate.
Red flags to watch for:
- The dealer quotes a lower monthly payment but won’t confirm the APR in writing.
- The APR on the contract differs from what was discussed verbally.
- Fees appear in the financed amount that weren’t disclosed upfront.
- The term is longer than you requested, making the payment look lower.
Dealerships work with multiple lenders and, per NerdWallet’s research, often add a markup to the lender’s base rate. Shopping multiple lenders before you arrive removes the dealer’s information advantage.
APR versus interest rate: what’s actually included?
These two terms are often used interchangeably, but they’re not the same thing.
The nominal interest rate (sometimes called the note rate) is the annual percentage used to calculate your interest charges on the outstanding balance. The APR (Annual Percentage Rate) includes that interest rate plus any lender fees rolled into the loan, expressed as a single annualized cost. On a simple interest auto loan, the APR and the interest rate are often very close, but fees can still push the APR higher.
Common fees that can affect APR:
- Origination fees: charged by some lenders to process the loan
- Dealer processing or documentation fees: sometimes rolled into the financed amount
- Acquisition fees on certain lease-to-loan conversions
Fees that typically fall outside the APR calculation:
- Late payment penalties
- Prepayment penalties (rare on auto loans but worth confirming)
- GAP insurance premiums added after closing
Always ask for the APR in writing, not just the interest rate. If you suspect fees are buried in the loan, request a full loan payoff schedule. The schedule shows exactly how each payment splits between principal and interest, making hidden costs visible.
How the averages in this article were selected
The headline figures here rely primarily on three public datasets:
- Experian’s State of the Automotive Finance Market (quarterly): the most widely cited source for national averages by credit tier, loan type, and term. Updated each quarter with data from Experian’s credit bureau.
- Edmunds monthly APR snapshots: dealer-transaction data updated monthly, useful for state-level comparisons and short-term trend tracking.
- FRED/Federal Reserve ALFRED series (monthly, RIELPCFANNM) and the Bankrate Monitor series (weekly, BRMALR0101): government and survey-based indexes that provide independent cross-checks on lender-reported rates.
One important caveat: Dealertrack origination data (used by Cox Automotive) tends to show higher average APRs for prime borrowers than Experian’s population-level figures, because it captures dealer-originated loans where markups are more common. That difference is a feature, not a flaw. It’s exactly why cross-referencing matters.
This article is updated as new quarterly Experian data and monthly Edmunds figures are released. For live rates between updates, check the sources listed in the final section below.
How Baywall turns public averages into your personal benchmark
National averages tell you what the market looks like. They don’t tell you whether your specific offer is fair. That’s the gap Baywall fills.
You enter five inputs: your credit score, the vehicle details, the loan amount, the loan term, and the APR the dealer quoted. Baywall benchmarks that offer against comparable transaction data from buyers with similar profiles, same credit tier, same loan type, and similar vehicle age.
The output is a personalized report that includes:
- A verdict label (great, fair, or high) for the dealer’s quoted APR
- A target APR to negotiate toward, based on what comparable buyers actually paid
- An estimated dollar savings if you negotiate to the target rate
- Comparable vehicle pricing so you can also pressure-test the purchase price
Think of it as a second opinion from the data, delivered before you sign anything. If the report labels your offer “high,” you have a specific number to bring back to the dealer. If it labels it “great,” you can sign with confidence.
Key Takeaways
New-car buyers face average APRs near 6.39%, with used-car buyers facing higher rates averaging 11.43% as of Q1 2026 (Experian). Your credit tier can significantly influence your actual offer. Longer loan terms increase total interest costs. Securing preapproval helps you negotiate better rates. Personalized benchmarking tools can help further refine your negotiation strategy.
The number most buyers never ask for
Most car buyers walk into a dealership knowing the sticker price and the monthly payment they can afford. Very few know the buy rate on their loan. That single piece of information, the base rate the lender actually approved before the dealer adds a markup, is where a significant portion of dealer profit on financing comes from. The national averages published by Experian and tracked by FRED are closer to that buy rate than to what many buyers end up paying.
The uncomfortable truth is that two buyers with identical credit scores, buying identical vehicles on the same day, can leave the same dealership with APRs that differ by 2 or 3 percentage points, simply because one knew to ask and one didn’t. Public averages are useful, but they’re a starting point. A personalized benchmark, one that accounts for your specific credit tier, vehicle, and loan structure, is what actually tells you whether the number on your contract is fair.
Before you sign, run the offer. The data already exists. You just need to know where to look.
Know your number before you sign
Most buyers spend hours researching the car and minutes reviewing the loan. Baywall flips that ratio where it matters most.
Enter your credit score, vehicle details, loan amount, term, and the dealer’s quoted APR. Baywall compares your offer against real transaction data from comparable buyers and returns a verdict (great, fair, or high), a target APR to negotiate toward, and your estimated dollar savings if you push back. A basic check is free. The full personalized benchmarking report is $2.99, delivered instantly, and gives you the specific number to bring back to the dealer’s finance office.
You’ll need your credit score range, the vehicle’s year and type, the loan amount, the term in months, and the APR the dealer quoted. That’s it. Head to Baywall and run your offer before you commit to anything.
Useful sources for live auto loan rate data
Check these sources directly for the most current figures between article updates:
- Experian State of the Automotive Finance Market: Quarterly averages by credit tier, loan type, and term. Best for understanding where your credit score places you in the national distribution.
- Edmunds car loan APR tool: Monthly national and state-level APR snapshots from dealer-originated transactions. Use this for state comparisons and short-term trend checks.
- FRED Bankrate Monitor series (BRMALR0101): Weekly lender survey data for the 60-month new-car rate. Useful for spotting rate movement between quarterly reports.
- FRED ALFRED series (RIELPCFANNM): Monthly Federal Reserve data on new-car finance rates, weighted by loan amount. The most government-authoritative benchmark available.
- Baywall: Personalized benchmarking against comparable transaction data. Use this when you have a specific dealer offer and want to know whether it’s fair for your profile.
This article provides general financial information for educational purposes. Confirm current rates and loan terms with your lender or a qualified financial professional before making any financing decision.