Compare Dealer APRs: Best Auto Loan Rate Charts to Set Your Target

Open the Statista monthly 60-month new-car loan series and the FRED 48-month finance rate series first. Match your loan term and credit tier to the chart, then hold your dealer’s quoted APR up against it before you sign anything.
TL;DR:
- The most reliable source for current auto loan rates is the weekly Bankrate index, especially when negotiating in real time.
- Match your exact loan term, type, and credit tier on the relevant chart to ensure an accurate comparison before accepting an offer.
- The average 60-month new-car APR was nearly 7% in mid-2026, roughly twice the rate from just a few years earlier, due to rising interest rates.
- Dealer quotes that are significantly higher than the chart benchmarks likely indicate room for negotiation, potentially saving over $2,000 in interest on a $30,000 loan.
- Public market charts do not account for dealer markup or your specific deal; use personalized benchmarks to verify whether an offer is fair or inflated.
Table of Contents
- Which Auto Loan Rate Charts Should You Check First?
- How to Read and Compare Auto Loan Rate Charts
- Where the Data on These Charts Actually Comes From
- What Auto Loan Rates Have Done Since 2021
- How to Turn a Chart Into a Negotiation Target
- Why We Think Charts Alone Don’t Finish the Job
- Check Your Offer Against Real Transactions, Not Just Averages
- Primary Sources and Charts to Bookmark
- Sources
Which Auto Loan Rate Charts Should You Check First?
Not every chart answers the same question, so knowing which one to open matters as much as knowing the number itself.
- Statista’s monthly 60-month new-car series is your go-to for month-by-month benchmarking. It tracks average APRs on 60-month new-car loans back to 2014, which makes it useful for spotting whether this month’s rate is a blip or part of a longer slide.
- FRED’s TERMCBAUTO48NS series covers 48-month new-car loans at commercial banks and ties directly to the Federal Reserve’s G.19 Consumer Credit release. It’s the most authoritative government-linked number available, and it stretches back decades for long-term context.
- Bankrate’s Data Center publishes a weekly auto loan index, which beats monthly charts when you’re negotiating this week and want a fresher snapshot than a month-old average.
- Compiled tables like Statista’s work best when you want a clean historical line to show a dealer. Weekly indices work best when you’re mid-negotiation and need the most current read possible.
Use the monthly charts to understand where rates have been. Use the weekly index to confirm where they stand right now.
How to Read and Compare Auto Loan Rate Charts
A rate chart only tells you something useful if you compare it against the right slice of the market. Here’s the checklist:
- Match your loan term. A 60-month APR and a 48-month APR are not interchangeable. Charts label their term for a reason.
- Match loan type. New-car and used-car rates run on separate tracks, often two to three points apart, so pull the used-car series if that’s what you’re financing.
- Match your credit tier. Credit-score bands drive the biggest APR swings you’ll see anywhere, often larger than the swings caused by the Fed.
- Check the reporting cadence. A weekly index reflects last week’s quotes; a monthly series can lag current market conditions by several weeks. Neither is wrong, but they’re not measuring the same moment.
- Watch your labels. “APR” includes fees and finance charges. “Finance rate” and advertised teaser rates often don’t. A dealer quoting a rate below every chart you’ve checked is usually leaving something out.
Pro Tip: Comparing a 48-month chart against a 60-month quote? A rough rule of thumb is to add about 0.15 to 0.40 percentage points when moving from 48 months to 60 months for the same credit tier and lender type. It’s an approximation, not gospel, but it keeps you from comparing apples to oranges mid-negotiation.
Where the Data on These Charts Actually Comes From
Knowing the source behind a chart tells you how much weight to give it.
- FRED’s G.19 release feeds the TERMCBAUTO48NS series, updated monthly from commercial bank data the Federal Reserve collects directly. It’s the closest thing to an official government number in this space.
- Bankrate’s Data Center compiles a weekly index built for embedable charts and quick market snapshots, which is why it’s a favorite for real-time checks rather than long-term trend analysis.
- Statista’s monthly series compiles industry data into a running 60-month table, useful for its long historical sweep, though it’s a licensed aggregator rather than a primary regulator.
None of these charts capture your dealer’s markup, your state’s fee structure, or the specific reserve a finance manager tacked onto your quote. They show market averages, not your exact deal.
What Auto Loan Rates Have Done Since 2021
The short version: rates roughly doubled, then gave a little of it back according to the latest mortgage rate forecast that explains broader economic trends influencing lending rates. That run-up tracked the broader tightening cycle the Fed used to fight inflation, and auto lenders adjusted their pricing in step with it.
By mid-2026, the picture has softened but not reversed completely. Statista’s July 2026 reading puts the 60-month new-car average at 6.97%, while FRED’s 48-month series showed 7.47% in May 2026.
How to Turn a Chart Into a Negotiation Target
Charts are only useful once you convert them into a number you can say out loud in a finance office. Here’s the workflow:
- Pick the chart that matches your loan exactly. New or used, 48 or 60 months. Don’t eyeball a different term and hope it’s close enough.
- Find the recent average, then adjust for your credit tier. A published market average usually reflects a blended pool of credit scores. If you’re in the top tier, expect to beat it; if you’re rebuilding credit, expect to sit above it.
- Calculate your target APR and dollar savings. Say the chart shows 6.97% and your dealer quoted 9.5% on a $30,000, 60-month loan. That gap of roughly 2.5 points can mean over $2,000 in extra interest across the life of the loan, depending on your exact terms. That’s real money, often enough to cover a vacation you’d otherwise skip.
- Watch for warning signs. A dealer who won’t tell you the buy rate, who bundles add-ons into the APR without itemizing them, or who claims “everyone pays this” without showing comparable data is asking you to negotiate blind.
If the dealer’s number sits close to your chart benchmark, you’re likely looking at a fair offer. If it’s a full point or more above, you have room to push, and now you have the number to push with.
Why We Think Charts Alone Don’t Finish the Job
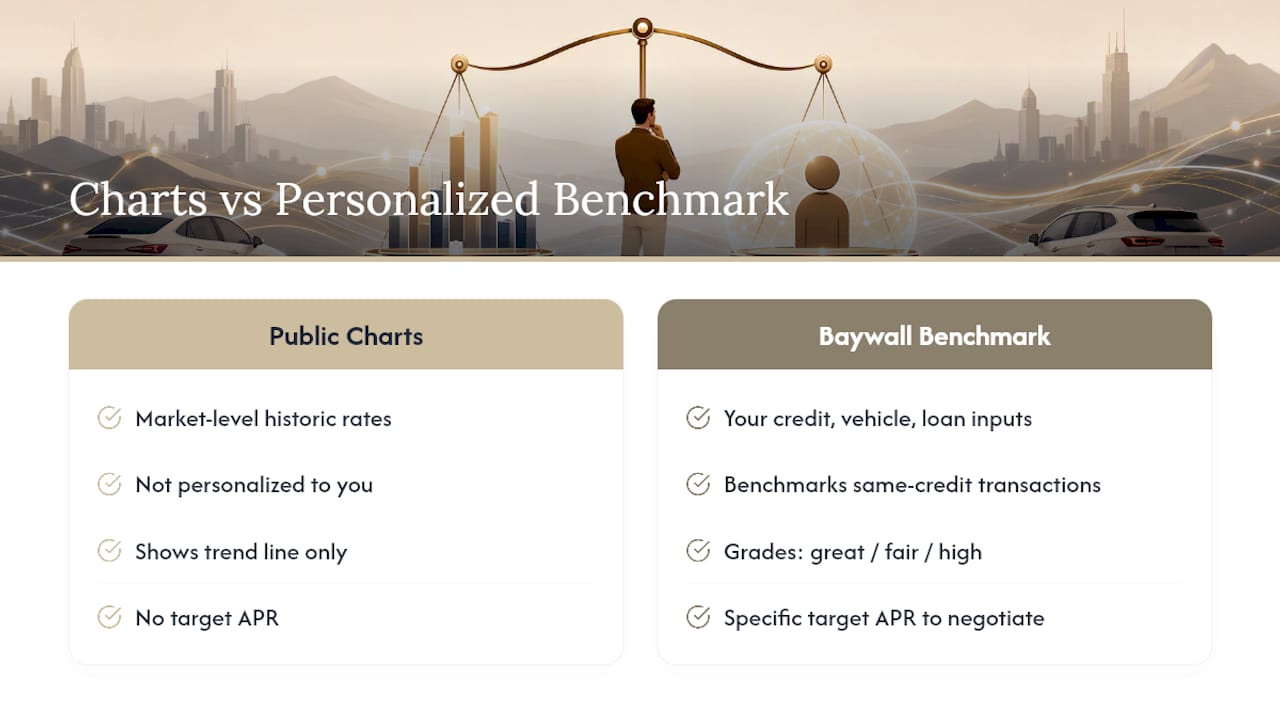
Public charts tell you what the market did last month or last week. They don’t tell you what your deal should look like, because they can’t account for your exact credit score, your specific vehicle, or the markup a dealer folded into your quote. That’s the gap Baywall was built to close.
You enter your credit score, vehicle, loan amount, term, and the dealer’s quoted rate. Baywall benchmarks that offer against real transactions from buyers in your same credit tier and loan type, then tells you whether it’s great, fair, or high, along with a specific target APR to negotiate toward. Chart data gives you the trend line. A personalized benchmark gives you the number for your actual paperwork. Check both before you sign.
— Baywall
Check Your Offer Against Real Transactions, Not Just Averages
Baywall gives you something a market chart can’t: a benchmark built from your exact credit tier, vehicle, and loan terms, not a blended national average. If your dealer quoted you an APR and you’re not sure whether it’s fair, this is the fastest way to find out before you sign.
Enter your credit score, the vehicle, your loan amount, term, and the dealer’s rate, and Baywall’s analysis tool benchmarks it against comparable deals to show whether you’re looking at a great offer, a fair one, or one worth pushing back on. You’ll get a target APR to negotiate toward and an estimate of what you’d save. It’s a one-time report, not a subscription, and your information stays private to your report. Run your numbers through Baywall before you head back to the finance office.
Primary Sources and Charts to Bookmark
- FRED’s TERMCBAUTO48NS series: monthly, tied to the Federal Reserve’s G.19 release.
- Bankrate’s Data Center: weekly index for real-time checks.
- Statista’s 60-month new-car table: long historical run for trend context.
- Baywall’s old car loan rate history for deeper background on how far rates have moved.
Sources
- Finance Rate on Consumer Installment Loans at Commercial Banks, New Autos 48 Month Loan | FRED | St. Louis Fed
- Historical auto loan rates in U.S. 2026 | Statista
- Data Center Auto Loan Rate Index | Bankrate